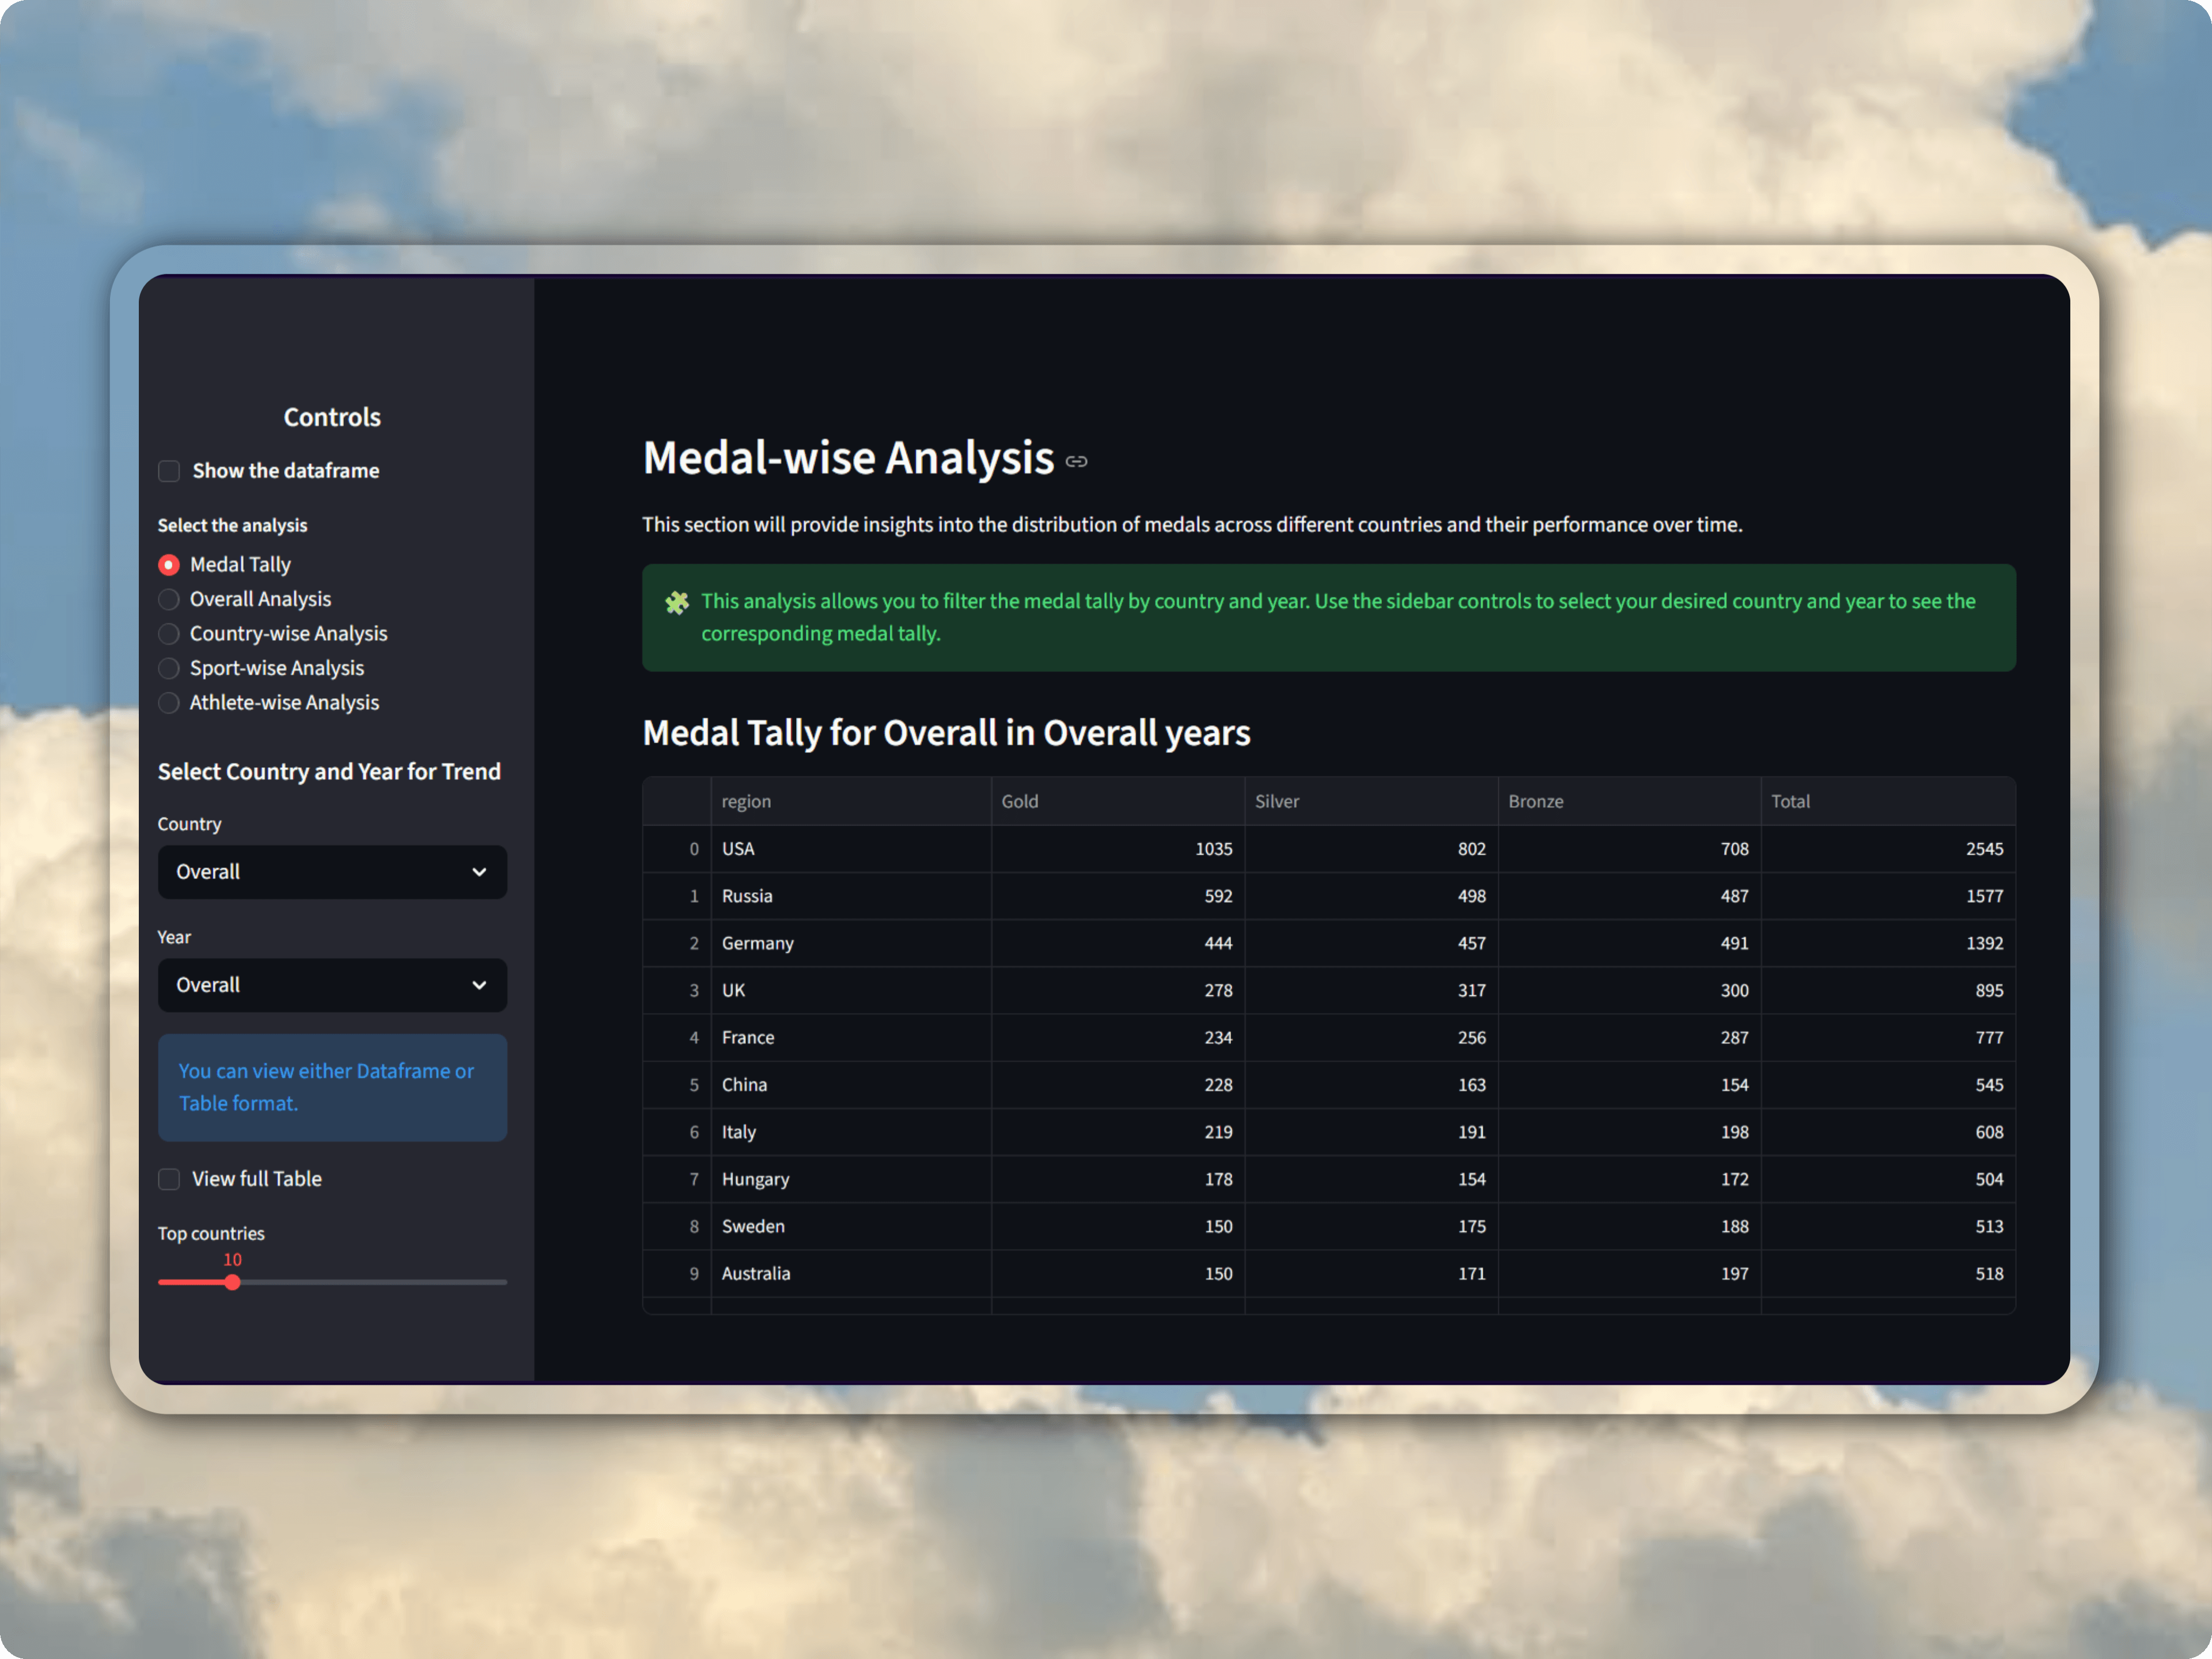
Olympics Data AnalysisPythonStreamlitKaggleNumPyPandasPlotlySeabornKaggle data shaped with Pandas and NumPy, then visualized through Plotly and Seaborn in Streamlit.PreviousMusic Recommendation MLOpsNextSommaire AI